
Normal :


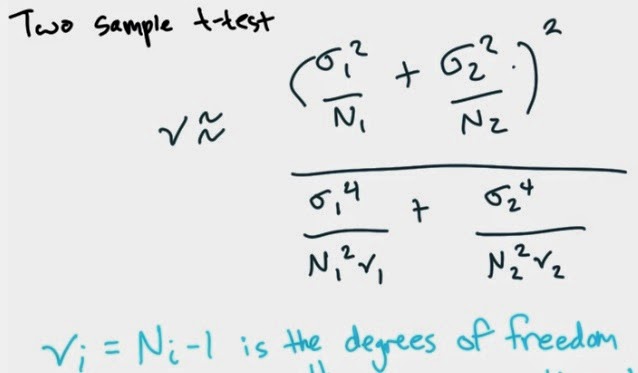
T-Test:
A t-test is any statistical hypothesis test in which the test statistic follows a Student's t distribution if the null hypothesis is supported. It can be used to determine if two sets of data are significantly different from each other, and is most commonly applied when the test statistic would follow a normal distribution if the value of a scaling term in the test statistic were known.
2 Version Of T-Test:
- Equal Sample Size
- Same Variance

P-Value
p-value is the probability of obtaining a test statistic result at least as extreme as the one that was actually observed, assuming that the null hypothesis is true.
Welch's T-Test Exercise:
import numpy
import scipy.stats
import pandas
def compare_averages(filename):
"""
Performs a t-test on two sets of baseball data (left-handed and right-handed hitters).
You will be given a csv file that has three columns. A player's
name, handedness (L for lefthanded or R for righthanded) and their
career batting average (called 'avg'). You can look at the csv
file via the following link:
https://www.dropbox.com/s/xcn0u2uxm8c4n6l/baseball_data.csv
Write a function that will read that the csv file into a pandas data frame,
and run Welch's t-test on the two cohorts defined by handedness.
One cohort should be a data frame of right-handed batters. And the other
cohort should be a data frame of left-handed batters.
We have included the scipy.stats library to help you write
or implement Welch's t-test:
http://docs.scipy.org/doc/scipy/reference/stats.html
With a significance level of 95%, if there is no difference
between the two cohorts, return a tuple consisting of
True, and then the tuple returned by scipy.stats.ttest.
If there is a difference, return a tuple consisting of
False, and then the tuple returned by scipy.stats.ttest.
For example, the tuple that you return may look like:
(True, (9.93570222, 0.000023))
"""
baseballdf = pandas.read_csv(filename)
leftdf = baseballdf[baseballdf['handedness'] == "L"]
rightdf = baseballdf[baseballdf['handedness'] == "R"]
#print leftdf['avg']
stat = scipy.stats.ttest_ind(rightdf['avg'], leftdf['avg'], equal_var = False)
print stat
sig = 0.05 > stat[1] -stat[0]
#print sig
out = (sig, stat)
print out
return out
No comments:
Post a Comment